Improving your organisation with network analysis
I. Introduction
Remember when organisations used to be simple? Maybe not, it was a while ago. But there was a time that the local police department consisted of just a few uniformed officers, managed by a chief, and hospitals were just a single building, where specialists could work more or less independently from the others. For most organisations, those days are now over. In the span of just a few decades, many organisations have turned into exceptionally complex systems made up of individuals, groups, and resources that interact in a huge variety of ways.
This is not going to change. Our modern ways of working are much more efficient than the old ones, but they do require a lot more specialisation and coordination. Rapid improvements in technology, a greying population, and increasing job mobility mean that organisations will likely become even more complex in the near future.

The future of work … according to an AI
Management science has struggled to keep up with this transformation. Traditionally, organisations have always been viewed using hierarchical models that focus on the formal structure and decision-making processes. X manages Y who manages Z, etc. This point of view, however, is becoming less and less useful. In complex organisations, information flows in all directions, and key insights and decisions rarely fit neatly into a top-down or bottom-up view anymore. What we need is a paradigm shift: rather than viewing organisations as hierarchies, we should be viewing them as networks.
This is not just a theoretical discussion, though. Viewing organisations as networks gives us some very powerful new options. A whole new way of thinking about how organisations work opens up. Even better, it gives us a whole new set of tools: mathematical network analysis.
Viewing organisations as networks allows us to understand the relationships and interactions between individuals and groups within the organisation, as well as how information, resources, and power flow through these networks. Network analysis can provide valuable insights into organisational behaviour and decision-making. Combining the insights of network analysis with deep data analytic tools like AI and Monte Carlo simulations (as XPNDR does) we can even come up with ways of improving the organisation at the network level. At a minimal cost.
In this article, we will explore the various ways in which organisations can be viewed as networks and the insights that can be gained through network analysis. We will discuss the structure of organisational networks, the dynamics of organisational networks, and the insights that can be obtained from network analysis. We will also provide a few examples of how network analysis can be used to understand and improve organisational performance. By the end of this article, you will have a better understanding of how to view your organisation as a network, and how to use network analysis to support your organisational goals and objectives.
II. The anatomy of organisational networks
A. Different types of networks
When we talk about viewing the organisation as a network, we are not talking about just one kind of network: there are many different networks to consider. For instance, the pure communication network: who communicates with whom. In this network, every person is a “node” (a dot) and every time two people communicate, we draw an “edge” (a line) between their nodes. This network is often easy to reconstruct, because electronic communication always leaves plenty of traces.
Another network inside the organisation is the more informal social network. Who do people know and like (or dislike). Although it is more complicated to reconstruct this kind of network (and we should ask ourselves whether we should want to), this network is intimately tied to the communication network. The two are linked to such a degree, that researchers have been able to reconstruct the social network from the communication network with 94% accuracy. A third network to consider is the “power network”: how do decisions flow throughout organisations, and which actors in the network can influence the outcomes of these.
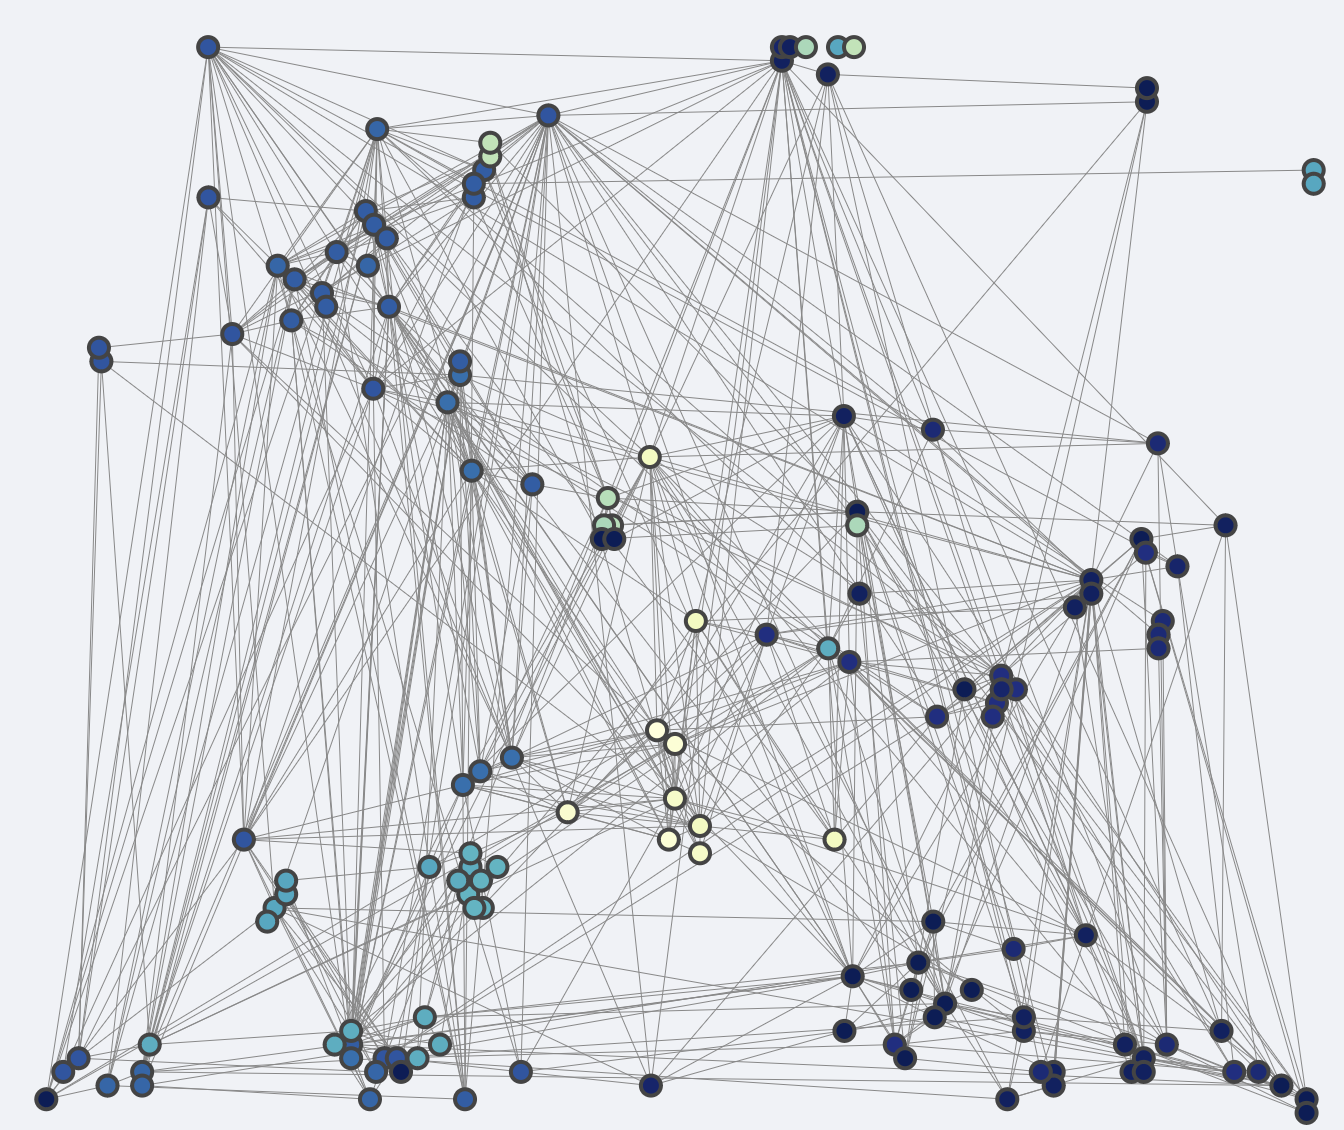
A map of the communication of a real organisation, as computed by XPNDR. Each node represents a person. A pair of nodes is connected by an edge if the two corresponding people had a meaningful amount of communication between them in the past two years. The colour of the nodes represents the teams the person is in. Note that this does not look very much like a hierarchy.
B. How network structure affects organisations
When you try to map out the communication network of a real organisation, you will quickly notice that the drawing starts to look like a mess: even the most well-run hierarchical organisations will have so many connections going in all directions that to humans, all networks look the same. But do not be fooled by this: networks have an anatomy, and the differences in the anatomies of real networks can be as different as the anatomies of a kangaroo and a trout. We just cannot see it. Computers, however, can. (Not surprisingly, when network scientists talk about networks, they often refer to it as a “zoo”.)
The anatomy of an organisational network is more than just a scientific curiosity: in real life it can have a big impact on the organisation's performance. For example, networks that are highly centralised, with a small number of highly connected individuals, may be more efficient, but also less adaptable to change. On the other hand, networks that are very decentralised, with many moderately connected individuals, may be less efficient but also more resilient and adaptable. Understanding the structure of an organisational network can help leaders identify the strengths and weaknesses of their organisation and make strategic decisions accordingly.
The analogy to anatomy has its limits, however. Anatomy is fixed, while organisations are dynamic. In real life, frogs cannot turn into princes. But for organisations, this is not a fairy tale. That is why many network scientists (including myself) prefer to talk about network structure rather than anatomy, and think of networks as dynamic, living things.
It is also important to note that the structure of networks does not need to be a purely strategic consideration: it can also be viewed with a growth mindset. Complexity gives a lot of freedom to choose, and as a result, achieving the right network structure is much more than a series of trade-offs or difficult decisions. With the right structure any organisation can be both efficient and resilient. It can be both a welcoming place to work, and a place with a functioning chain of command. It can be a place that can innovate quickly and steadily build up a long-lasting business model. With a considered approach, organisational structure is rarely an “either-or” type of question.
C. Example: Apple's Network Structure
Apple is famous for it’s excellent network structure. Historically, Apple was known for its “hub-and-spoke” model, a highly centralised organisational structure with a small group of executives making the key decisions: Apple’s “brain trust”. The efficiency of this model was long viewed as one of Apple’s main organisational strengths. Over the years, a downside did become apparent: this centralised approach was slowing down innovation, as started to become clear from Apple’s limited and slowly evolving line of products. To counteract this, Apple has in recent years invested heavily in developing more lateral connections in it’s organisational network structure, with great effect: Giving product development teams more autonomy to interact with each other, and the resources to do this, has allowed for more innovation and collaboration among cross-functional teams. The impact of this change is already evident in the company's product line-up: the Apple Watch came from the independent work of small multidisciplinary team that was able to create and develop new ideas independently from the CEO and the top executives. The value added is enormous: in 2022, Apple’s revenue from wearables was $41 billion, exceeding the revenue of their traditional product, Mac computers, which amounted to $40 billion.
III. The dynamics of organisational Networks
A. How information, resources, and power flow through networks
Organisations involve incredible amounts of communication: ideas bouncing off of each other, messages going back and forth, schedules changing in constant coordination. The volume of separate pieces of communication is so large that it makes sense to think of the total as a flow. Just like H2O molecules can make up liquid water, so can pieces of information make up an information flow. The remarkable thing about this analogy is that it is much more than just a mental picture: when we analyse the way real information flows mathematically, the models that are the best match are remarkably similar to models that physicists and engineers use for physical flows, like water and electricity.

The way information moves through organisations is not that different (mathematically) from the way water flows through a system of tunnels.
This analogy gives us a very powerful tool. You might expect that incredibly complex, human, social things like the way ideas, knowledge and influence travel, between the people, groups, and departments in the network would be out of reach of simple analytic tools, but at the highest level, that behaviour is about as simple as water, flowing through a network of pipes. By analysing how that flow works, we can understand how decisions are made, how information is disseminated, and how power is wielded.
For example, by analysing how ideas flow through a network, we can identify key influencers and decision-makers. We can see see how information spreads, and at what speed. We can identify bottlenecks, inefficiencies and potential areas for improvement.
B. Positive and negative outcomes of network dynamics
The dynamics of organisational networks can have both positive and negative effects on an organisation. For example, having tight-knit teams can lead to increased trust, cooperation, and creativity, but it can also lead to opinion bubbles, knowledge silos, and counterproductive social norms. Similarly, fast flow of information can lead to quicker decision-making and better response to changes, but also to power-imbalance, as there is less time for checks and balances to have an effect. This is why you cannot try to improve your network using only rough principles. You cannot decentralise a centralised organisation in the hopes of making it more resilient, and expect only positive outcomes. Unintended consequences are too likely to ignore. To get the desired effect, you need to balance the different forces, which requires a measured approach. Network analysis is the best tool for this job.
C. Example: using network analysis to help a struggling team
To illustrate the impact of network dynamics, let's look at another example.
Alice is the leader of the product development team. The team is working towards the launch of a new product, using the scrum methodology. The team, however, has been missing consecutive sprint deadlines for a few months now, as they keep discovering new problems that need to be handled.
Alice, who happens to have a PhD in mathematics, decides to try network analysis. Using the team’s internal communication metadata from Slack, email and their electronic calendar (with permission of the team members, of course) Alice models the teams internal network, and maps how information flows within the team. Because she only uses metadata, she does not have access to the content of the communication. She doesn’t need this anyways, because she is using tools from network analysis to analyse the information flow. Doing so, Alice identifies the roles each team member plays in this process. She can also see who is interacting with whom and how strong the connections are, and identify individuals who are less connected and may have less visibility on the project progress.
Using specific network algorithms, she notices is that Bob and Charlotte both play significant roles in this process, but that they rarely ever communicate with each other. She also notices that three team members are involved in 90% of all tasks, and that several other team members are hardly in touch with each other: her team has a small overloaded core, but is much less tight-knit than she had assumed.
With these insights, Alice can take concrete steps to improve communication. In the remaining sprints, Alice makes sure to create more opportunities for collaboration between Bob and Charlotte, and she reallocates some of the work from the core members to the less connected team members, involving them more actively. The interventions help Alice’s team to notice problems early on, distribute work load effectively, and ultimately achieve better results. They don’t miss another deadline.

A network map of the interactions of a (real) 16-person team. The colours indicate the score on a network algorithm. At a glance we see a few things: 1) A single individual (at the top) is not involved in any meaningful interactions with the team. 2) Only two individuals have contact with more than four colleagues. 3) There is no obvious structure to this team. This is, of course, a very superficial analysis. A deeper analysis that takes into account the context can reveal much more.
IV. Three levels of Network Analysis
A. Objective measurements of the organisation and its parts
Once we turn communication data into a network model of how people within the organisation interact, we can use that model to measure all kinds of things that were previously invisible. These measurements can give us fundamental insights into how the organisation functions. We can measure how many contacts a person has, and how meaningful these contacts are. On the individual level, this does not tell us a lot, but when we look at entire teams or groups, this gives us an effective way of estimating their ability to work together. We also can see how different parts of the organisation interact with each other, and we can see at a glance if there are any imbalances in the communication flows. If, for instance, two departments barely communicate with each other, we can quickly detect this from the data. We can also see it when communication behaviour changes, for instance when new communication flows start up, or when they end. Since these changes are often related to big changes in the organisation, tracking the sizes and directions of communication flows at the statistical level can be an excellent indicator for future output, and serve as a warning light for future problems.
B. Understanding the role of people and teams within the organisation with algorithms
Network structure is a determining factor in how well an organisation functions. We cannot see this structure with the naked eye, but using computers, we can make a model of it. By applying an array of algorithms to the model, we can find out the properties of this structure, and how this influences the way people function within the organisation. We can measure how influential a person is, how much others rely on their authority, how good they are at taking initiative, and how well they reach out to other parts of the organisation. Because these metrics are based on real data, it is an objective representation of the real interactions and communication within the organisation. This kind of analysis avoids any subjectivity and bias that can be present in self-reported or manager-reported data. Moreover, the data is really about the whole network, and not about any individual on their own, the structure only changes when collective behaviour changes. Because of their objectivity and dependence on collective behaviour, network algorithms are exceptionally resilient against perverse incentives. There is no way for individuals to “game” the system. This makes network analysis a very effective basis for all kinds of useful KPI’s.

Network KPI’s for an individual, computed by XPNDR on the basis of objective communication data. The values represent different qualities of this person within the network: these values are not only determined by the qualities of the person, but also by how well the current network allows them to use these qualities.
C. Improving the organisation with Monte Carlo simulations and AI
Knowing what an organisation’s strengths and weaknesses is good, but being able to improve them is better. The problem is that with any complex network, seeing which changes lead to improvements and which don’t is also very complex. Because we are dealing with flows, simply strengthening the weaknesses locally can have a waterbed effect, pushing the problems to a different part of the network. Therefore, before we implement any changes, we should compute what the effect will be on the whole network. By using advanced computational techniques like Monte Carlo simulations and unsupervised network AI, we can test different scenarios and identify the most effective ways to optimise the organisation's network structure to improve overall performance.
D. How to apply network analysis to your organisation
Network analysis is a very intuitive tool to understand how an organisation works, and how to improve it in terms of efficiency and resilience. Any organisation that is large enough can benefit from the insights of network analysis. And “large enough” is really not that large: in a group of ten people there are already over a thousand different network structures to consider, and the difference in quality between them can vary enormously. The number of configurations grows exponentially with the size of the organisation: for an organisation with a hundred employees, the number of possible networks is closer to 1,000,000,000,000,000,000,000,000,000,000,000. Without analytical tools, it would be impossible to make sense of this many configurations, but with computers and smart algorithms, it becomes totally feasible.
At XPNDR we have developed a set of simple tools and indicators that compute the most actionable insights and recommendations for any organisation. Using simple data that your organisation is sure to have, XPNDR constructs a model of the communication flows in your organisation, applies the algorithms, simulations, and AI. It presents the results in simple to understand recommendations, graphs, and explanations: in terms that people can understand. This way, XPNDR helps you bring the power of network analysis to your organisation, at a fraction of the cost and effort it would take to develop this internally.
V. Conclusion
In this article, we have explored the various ways in which organisations can be viewed as networks and the insights that can be gained through network analysis. We have argued why everyone should think about the structure of their organisational network, and what insights that can be obtained from network analysis.
By viewing organisations as networks, leaders and decision-makers can gain a deeper understanding of the complex interactions and relationships that exist within their organisations. This can help identify opportunities for improvement, support strategic planning and change management, and ultimately lead to better organisational performance.
Therefore, consider how network analysis can be used to understand and improve your organisation. Anybody, whether you're a leader, a manager, or an individual contributor, can use network analysis to improve your organisation on the basis of objective analytic insights. This can be the most cost-effective way to improve efficiency and resilience of your organisation, and, if you let XPNDR do the heavy lifting, one of the easiest ways too.
So, whether you have a small organisation or a large one, feel free to book a demo, to discover what network analysis can do for your organisation.